CLIENT: MYOB
MYOB: New UI for an online accounting product

The challenge
One of the most loved products at MYOB is BL*, a feature rich, desktop accounting service developed over thirty(!) years. As part of the broader company strategy, BL* is no longer being developed further and clients need to be migrated to an online solution called ESS* without alienating them and causing churn to competitors. The client base is locked due to feature gaps between the old and new software.
*To maintain company privacy, I have changed names and omitted and obfuscated confidential information in this case study.
My role
I joined this project in the early to midway stages and co-researched with the previous designer assigned to the role. I researched, designed and implemented changes to our online SME accounting product to introduce new usability features while maintaining the integrity of the product’s core value: Simplicity.
During this time I…
Researched, designed and co-facilitated our user research which included contextual inquiries, one-on-one interviews, surveys and usability testing through the design and build process.
Designed macro/micro interactions for how the quantities and hierarchical chart of accounts functionality were implemented in our ESS product.
Collaborated closely with our product manager, BAs, engineers and marketing team to ensure that the experience was consistent with the business strategy and problem areas (identified through testing) were addressed.
Note: Given the complexity of the products and the necessity for some domain knowledge, I attended a week long bookkeeping course when I joined MYOB. I also conducted listening tours with developers, product managers, product marketers, designers, training consultants and other stakeholders to gain an understanding of the history of MYOB (why are we in this position today) and what problems our products are solving.
Hypothesis
Feedback received for our online SME accounting software product ESS indicated that clients were unwilling to make the move from BL to ESS because of feature gaps between the old and new software. Feedback specifically mentioned issues with recording and reporting for agricultural clients. Given that 30% of clients have a significant number of agricultural practices, the product manager, previous product designer and BA had hypothesised that prioritising some of the features for agricultural clients may see an increase in migrations by up to 10%.
Discovery
Recruitment: Recruiting current users with practices that work in the agricultural market
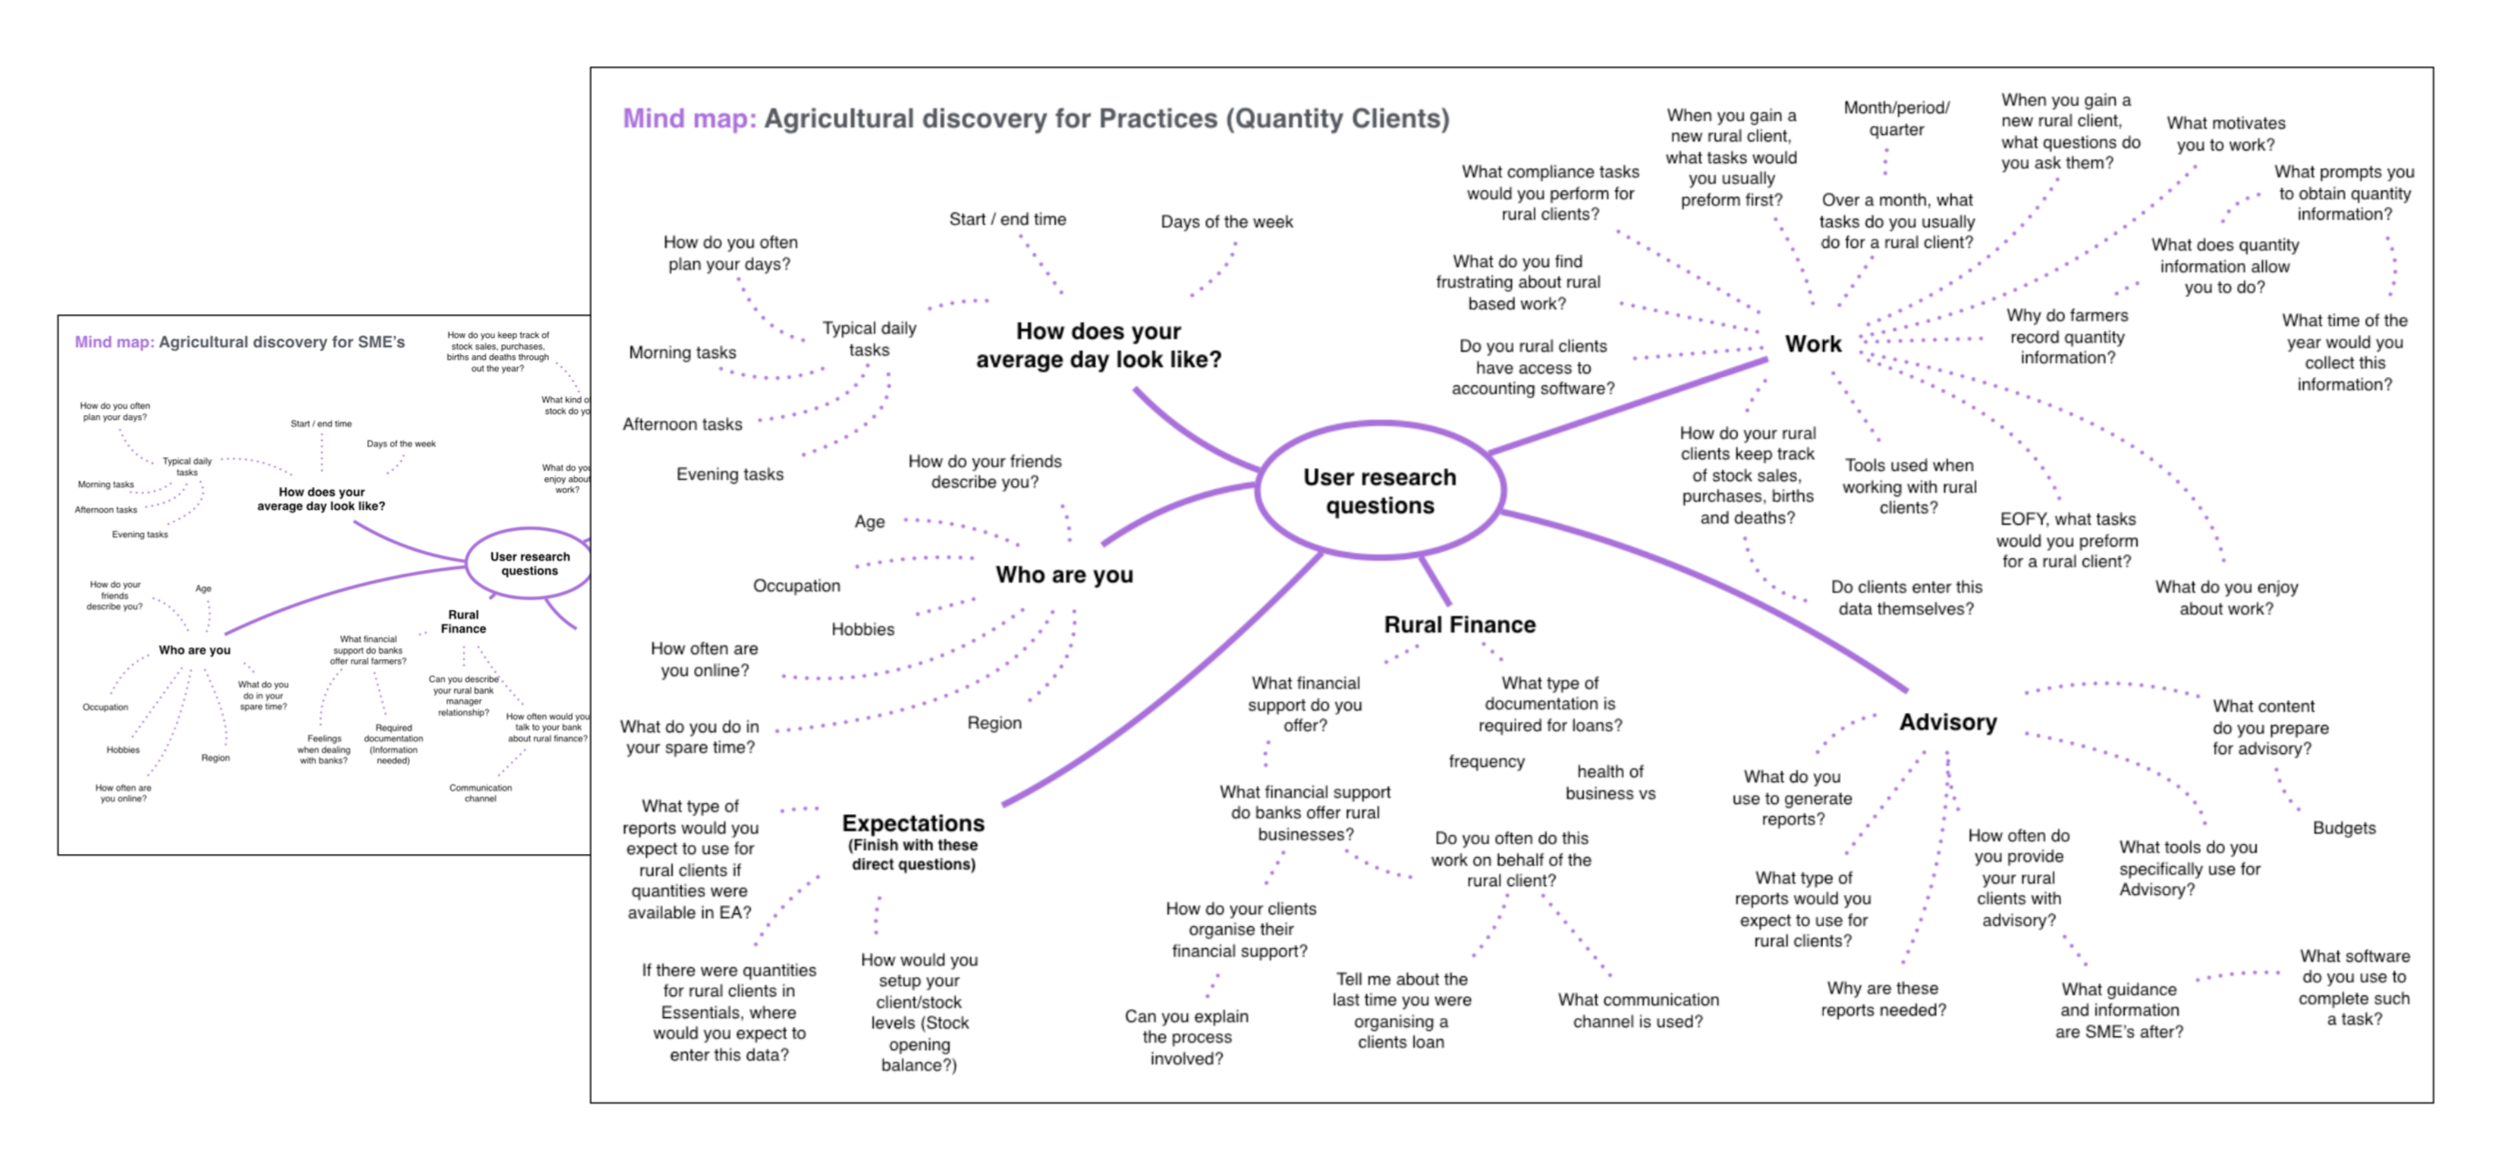
Contextual inquiry and interviews: Interviewing practices about agricultural accounting
Analysis and synthesis of research: Cluster and common themes
Prototype journey map: Experience map
Why map the experience?
We need to prioritise what features we were going to focus on. Complete feature parity is not possible within the short timeframe required to remain competitive so we needed a way to get the most gain out of the least amount of resources. The pain points for clients were actually well documented in their feedback. It was about breaking through the noise and figuring out which pain points totally blocked them from migrating.
Key insights
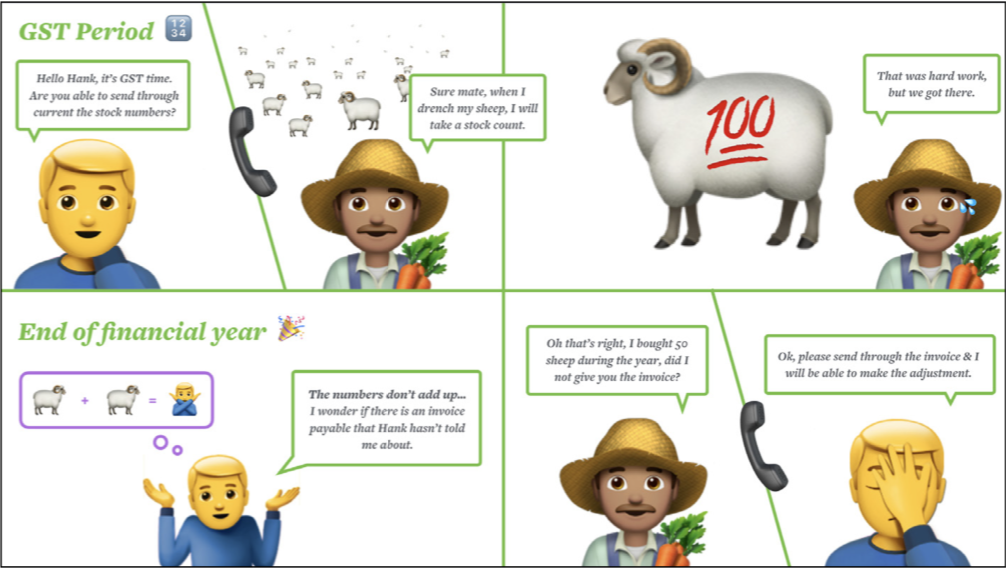
Ultimately, the research indicated that practices were reluctant to move to ESS because their farming clients were not supported with capturing and reporting quantities (of livestock for example) as well as the inflexible chart of accounts. By mapping the experience of accountants with their farming clients from initial engagement (new clients) through account setup, education of clients on software, collaboration between accountant and client and ultimately reporting and tax compliance. We learned that correct reporting is crucial for farmers who don’t want to miss out on tax benefits and timeous loans from the bank.
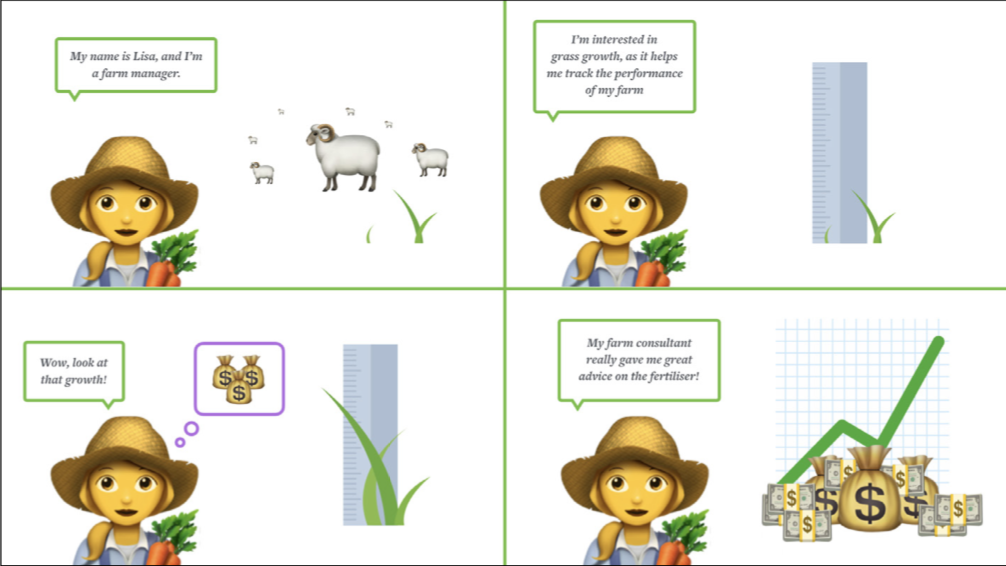
(1) A quantities feature would allow for farmers to report livestock and grain supplies and reflect their changes over time as well as trading with other farmers.
(2) A feature that allows for the chart of accounts to be customised by the accountant enables them to categorise a large list of accounts to allocate and keep track of transactions. Specifically enabling hierarchy would assist accountants with being able to flow through an unwieldy list of farming accounts as well as ‘separate’ out accounts for which their clients wanted to do their own recording. (Agricultural accounts lists run into the thousands).

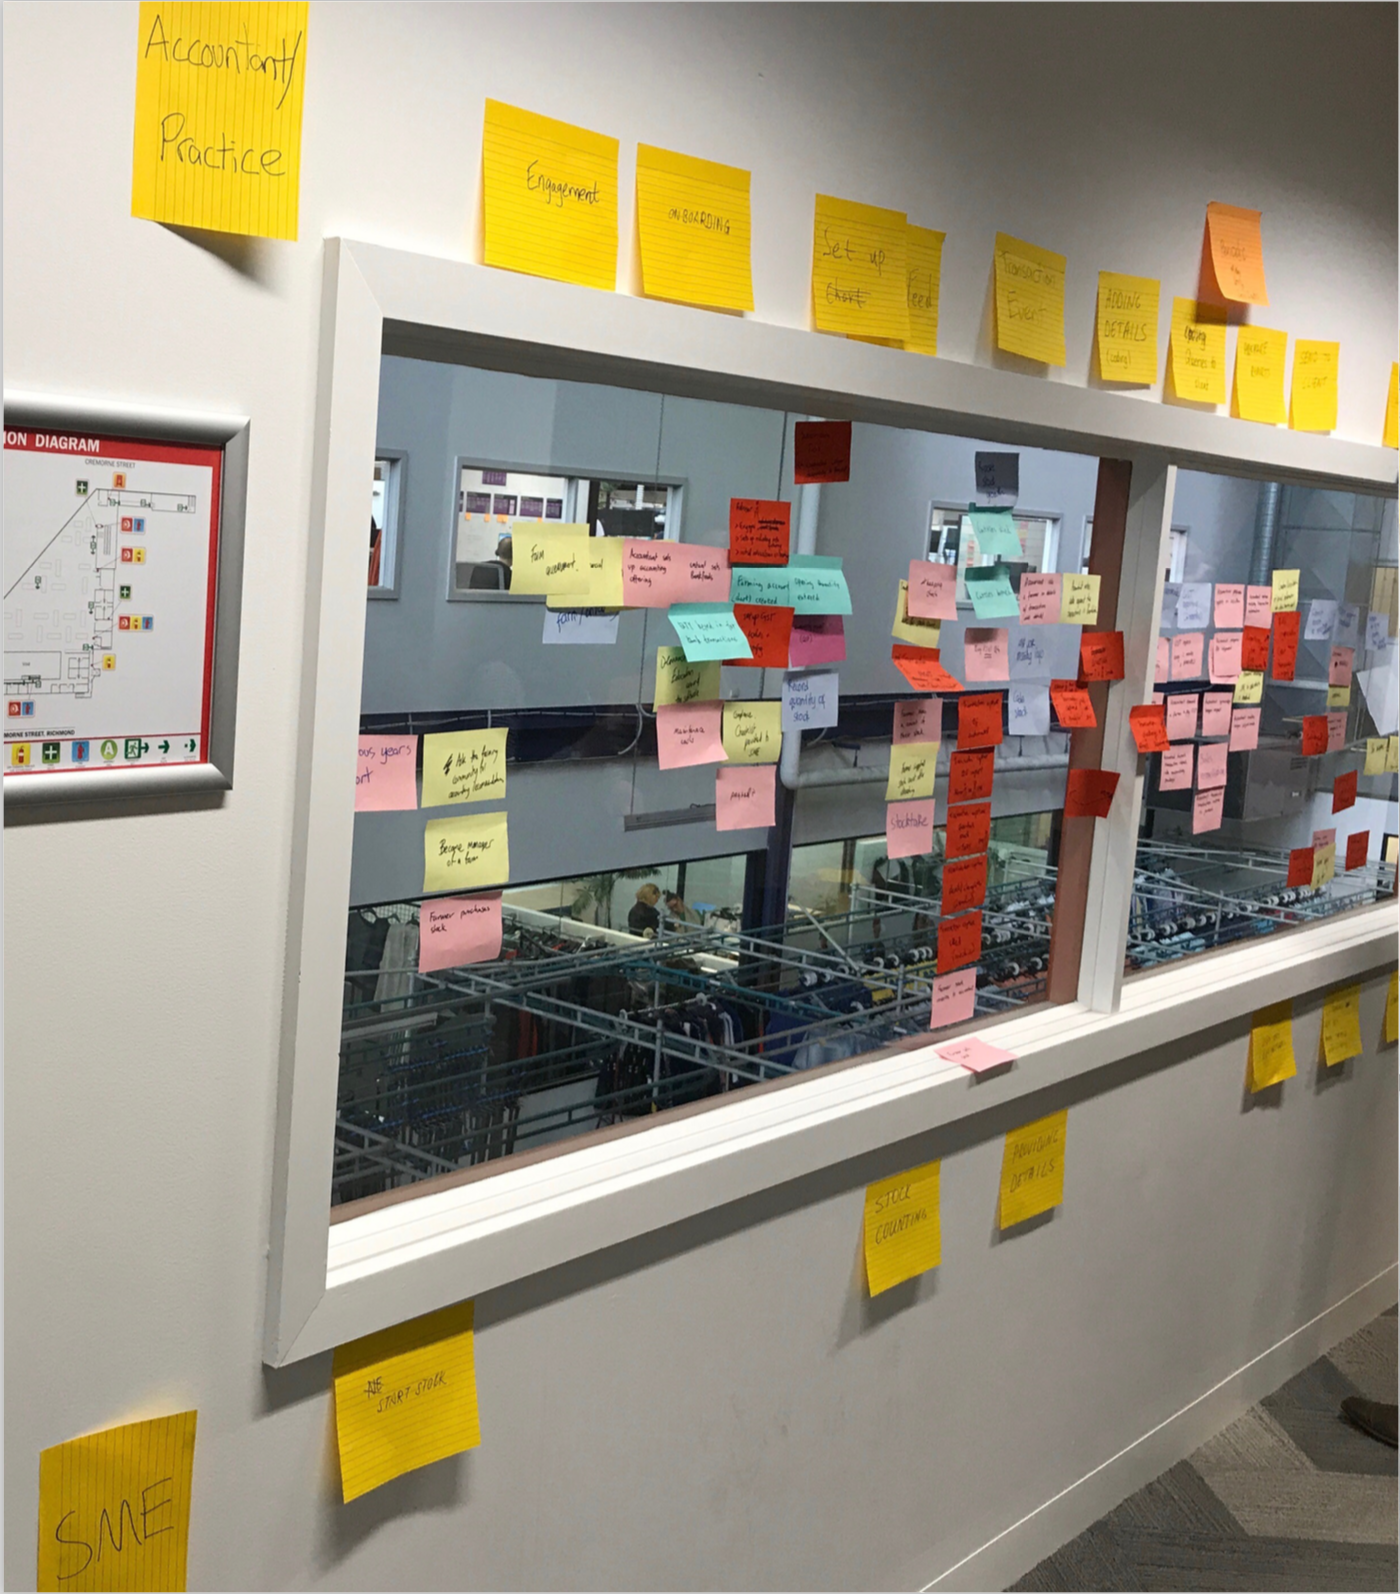
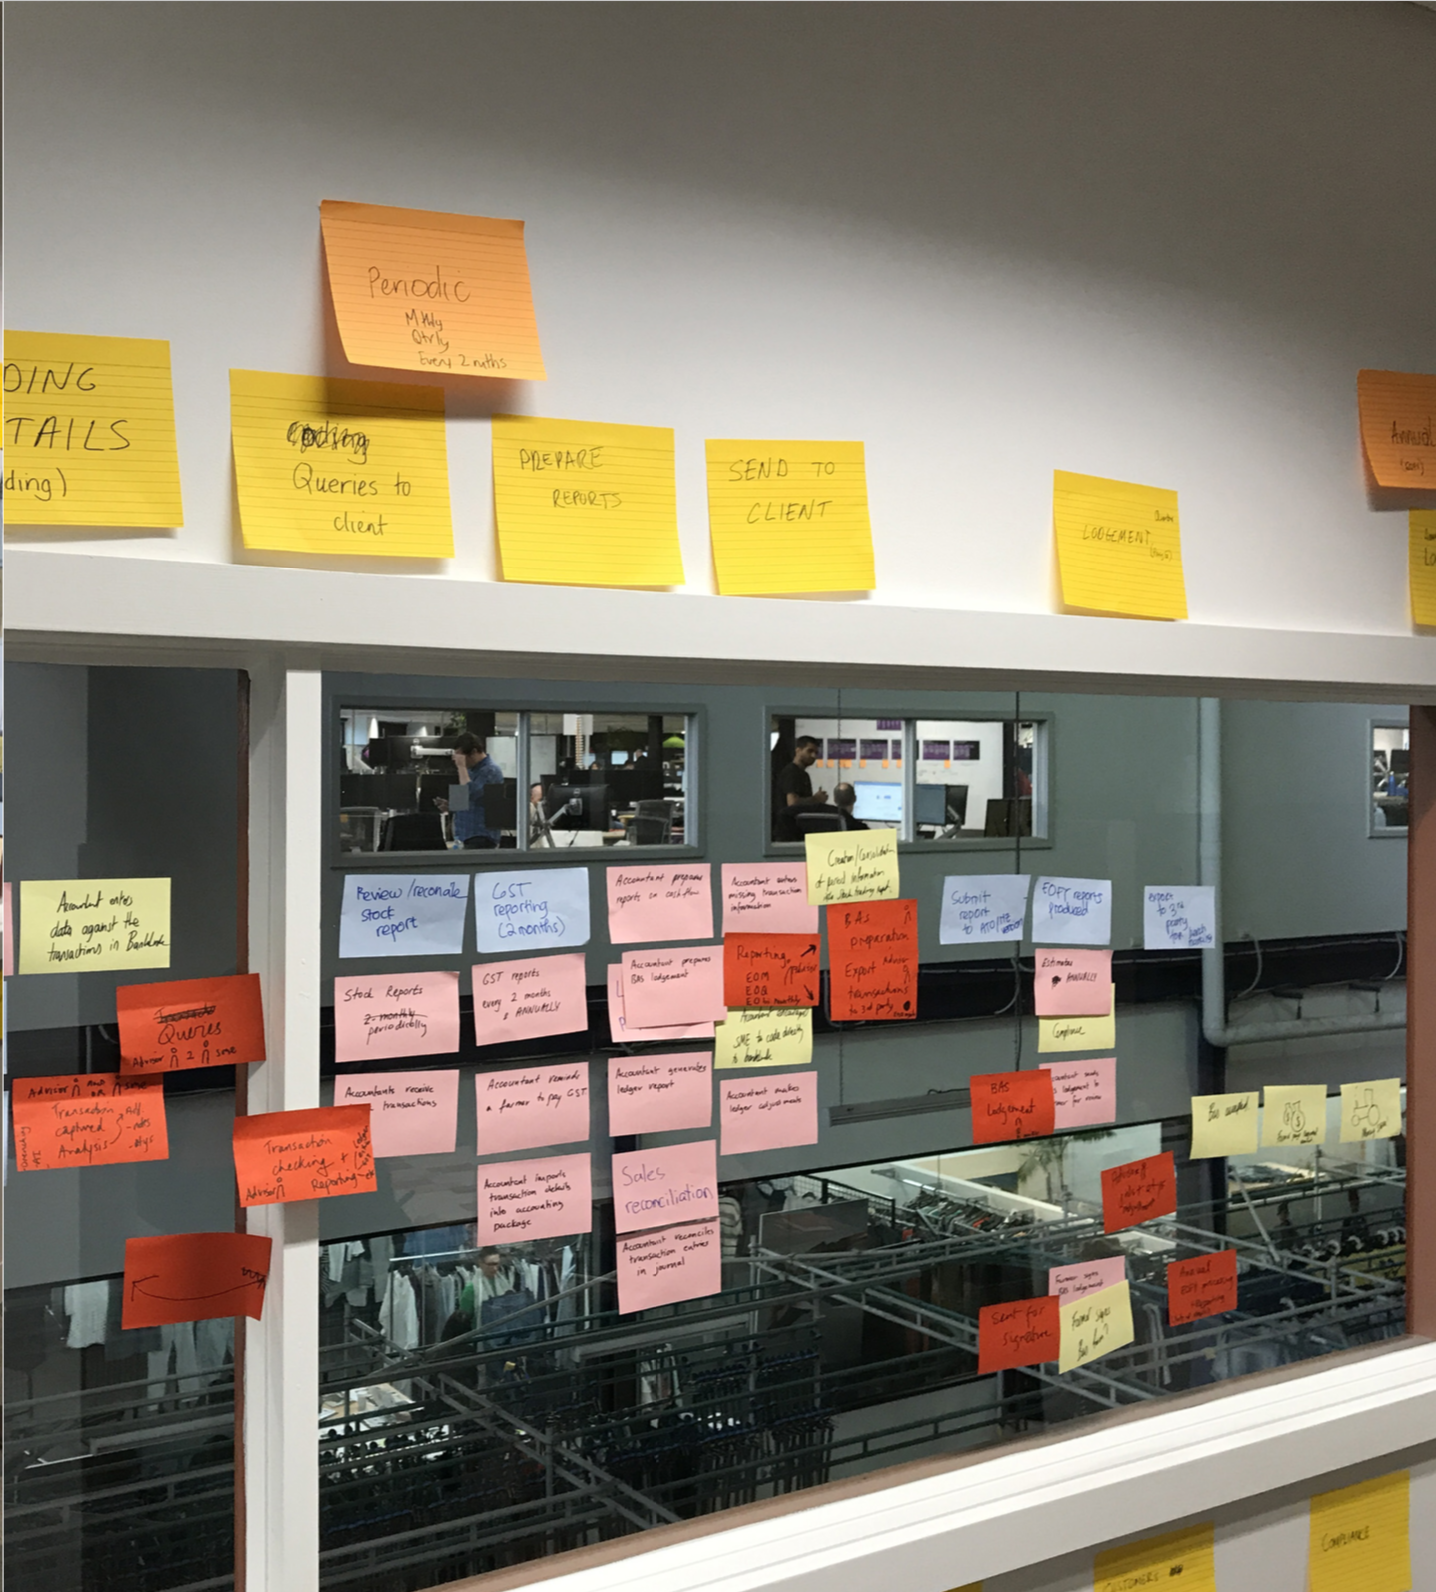
Final experience map from engagement (new client sign up) to reporting at end of financial year

Affinity mapping for common themes
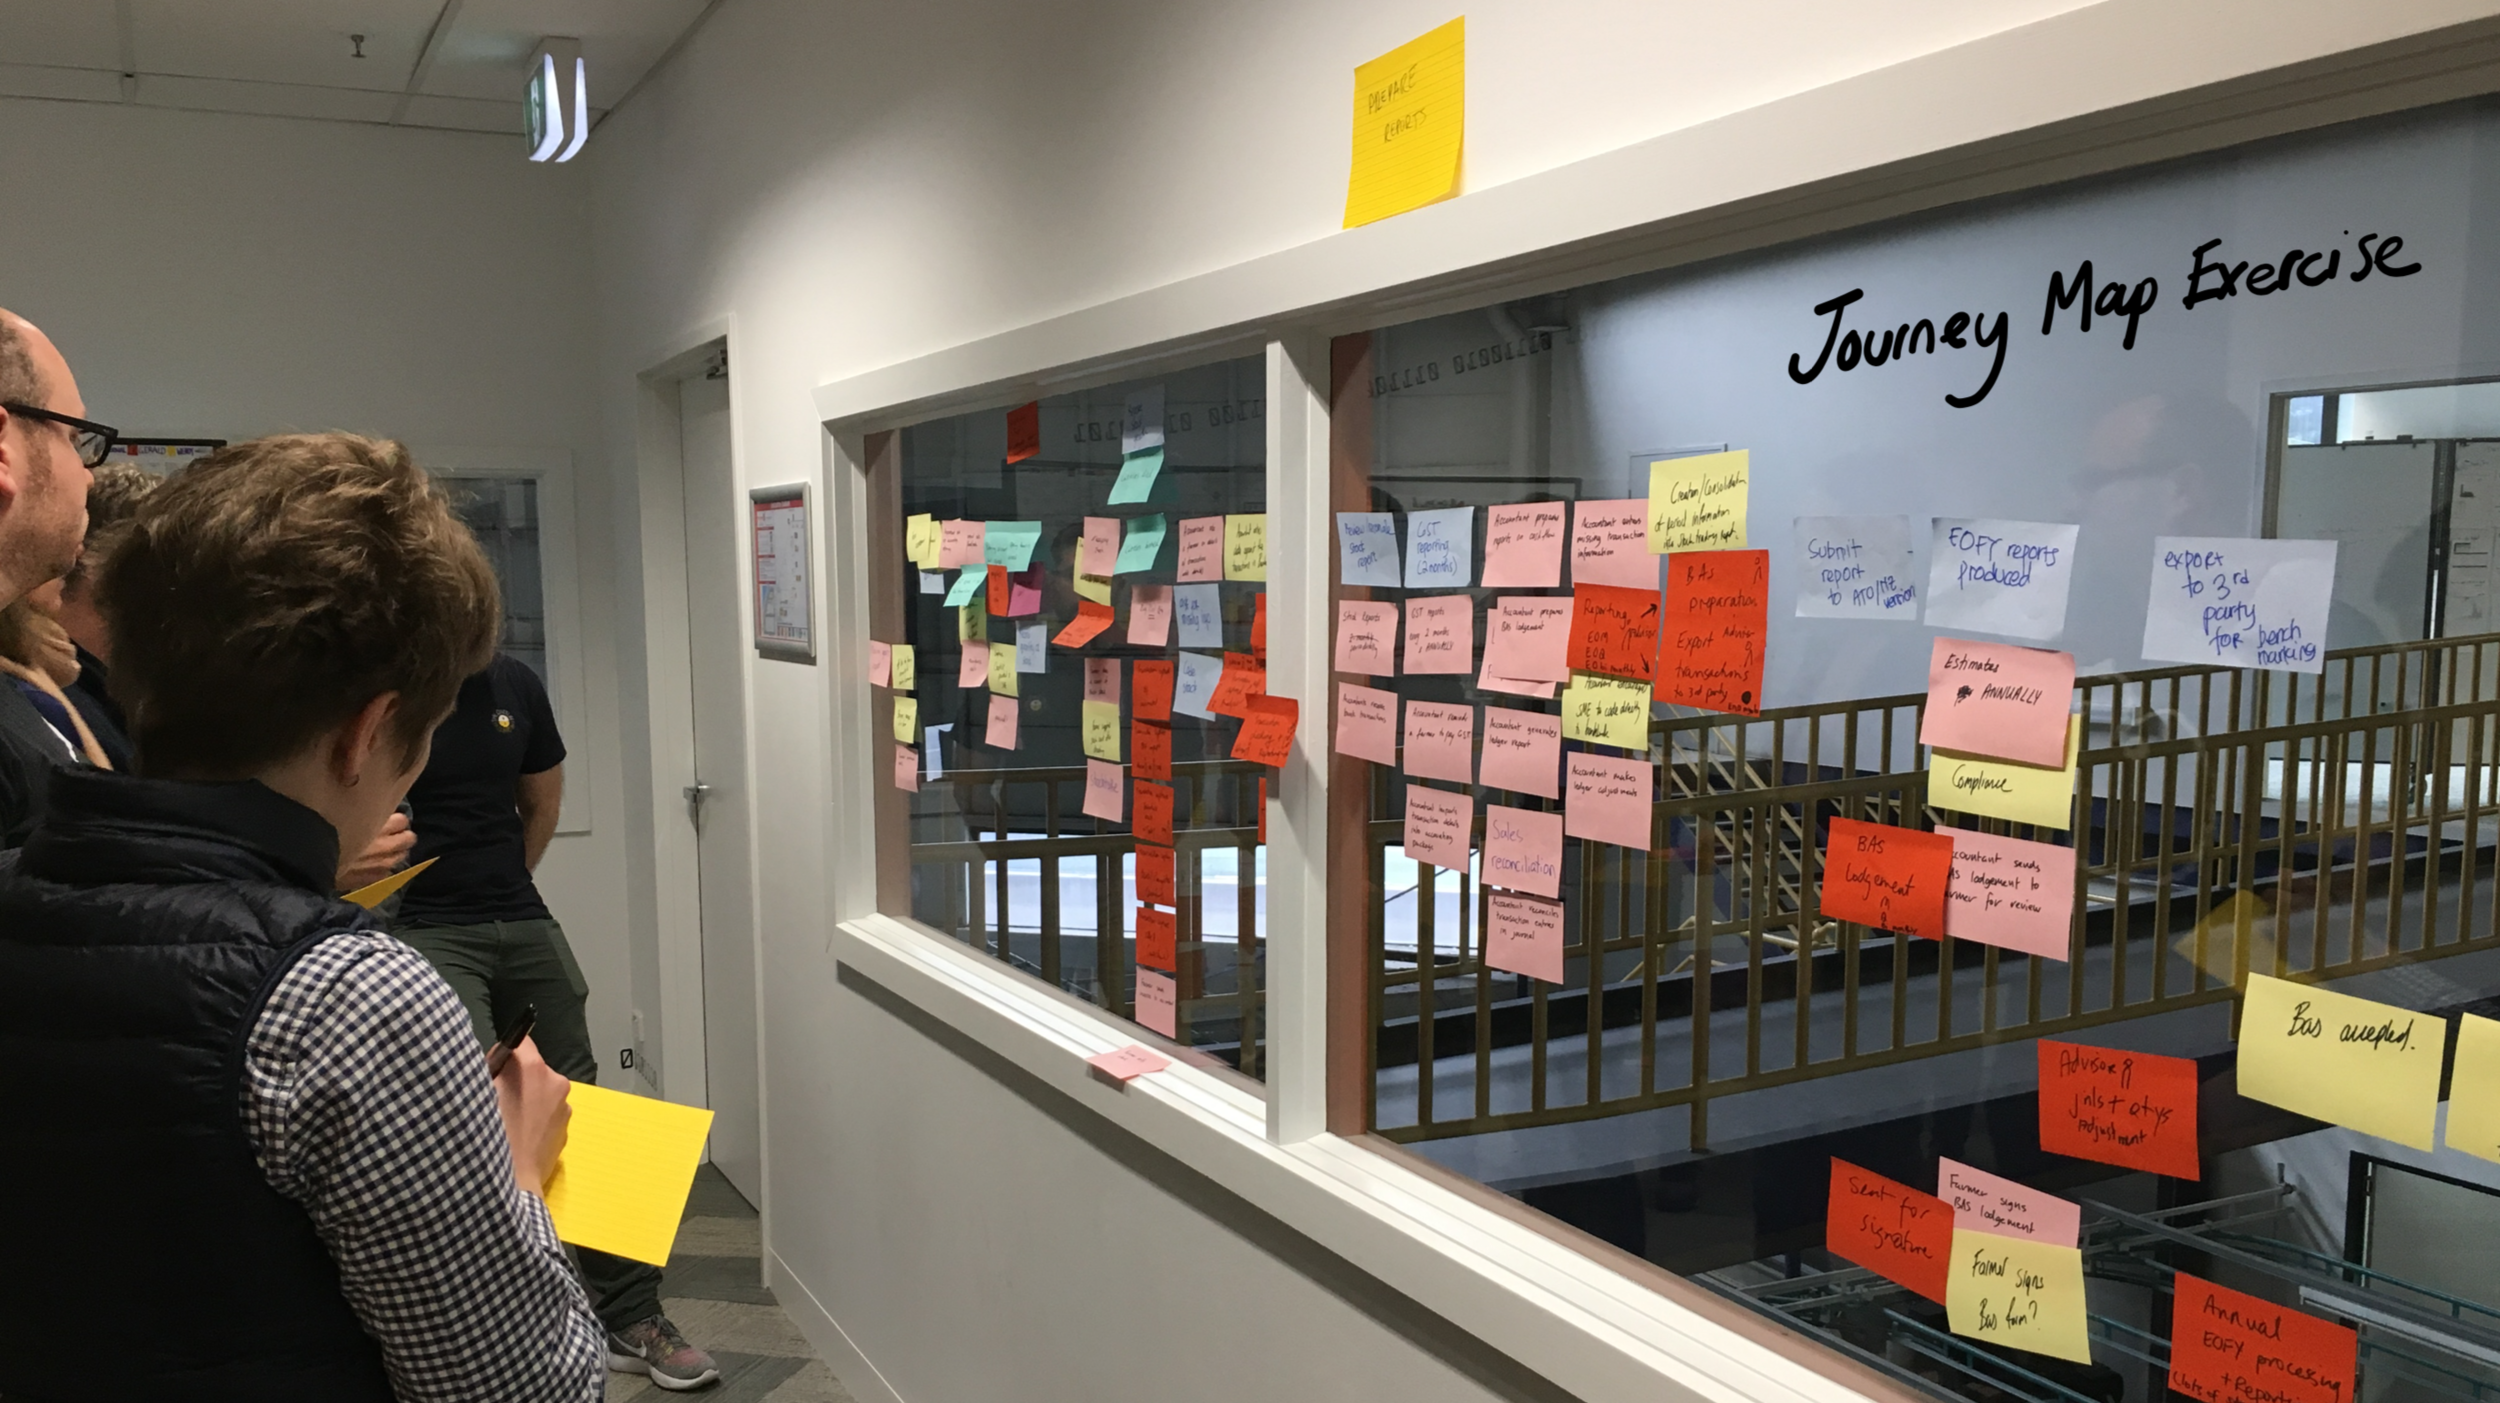
Journey map exercise with users

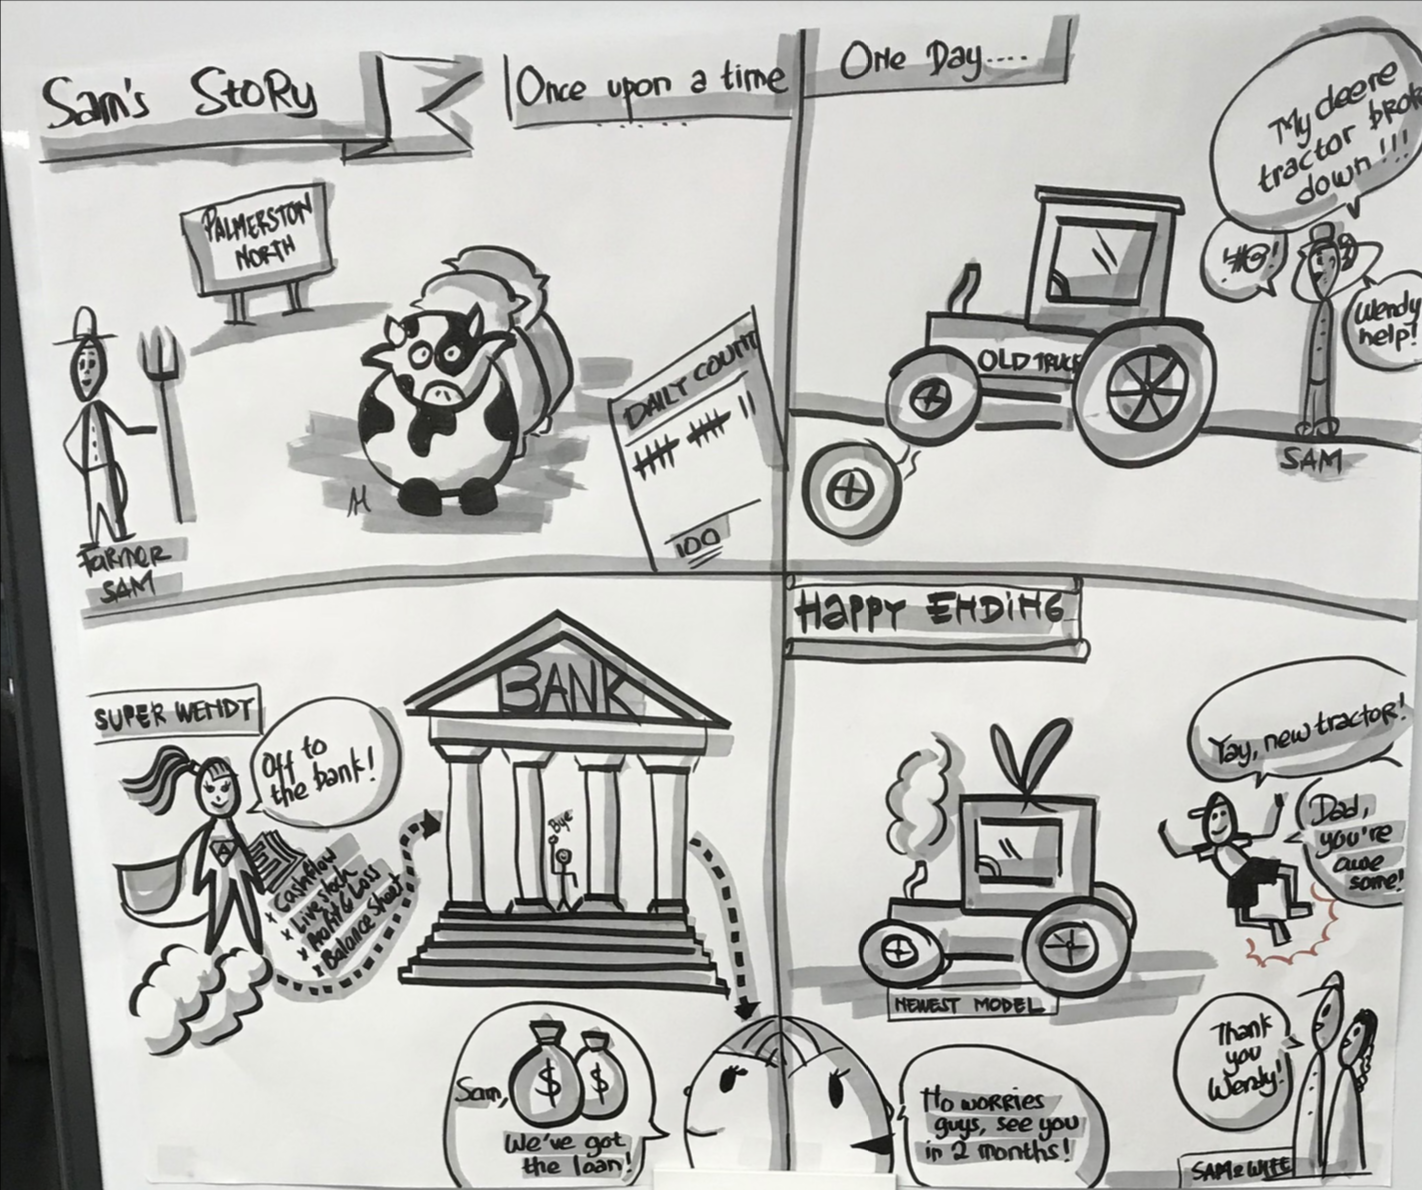
User sketch of a scenario with an agricultural client
Design sprint
Presenting back to the team (engineers, product manager, business analysts)
Running design workshops with the team to generate a broad selection of divergent design ideas from team members with different backgrounds and roles
Producing initial prototypes to test on a small set of 10 users

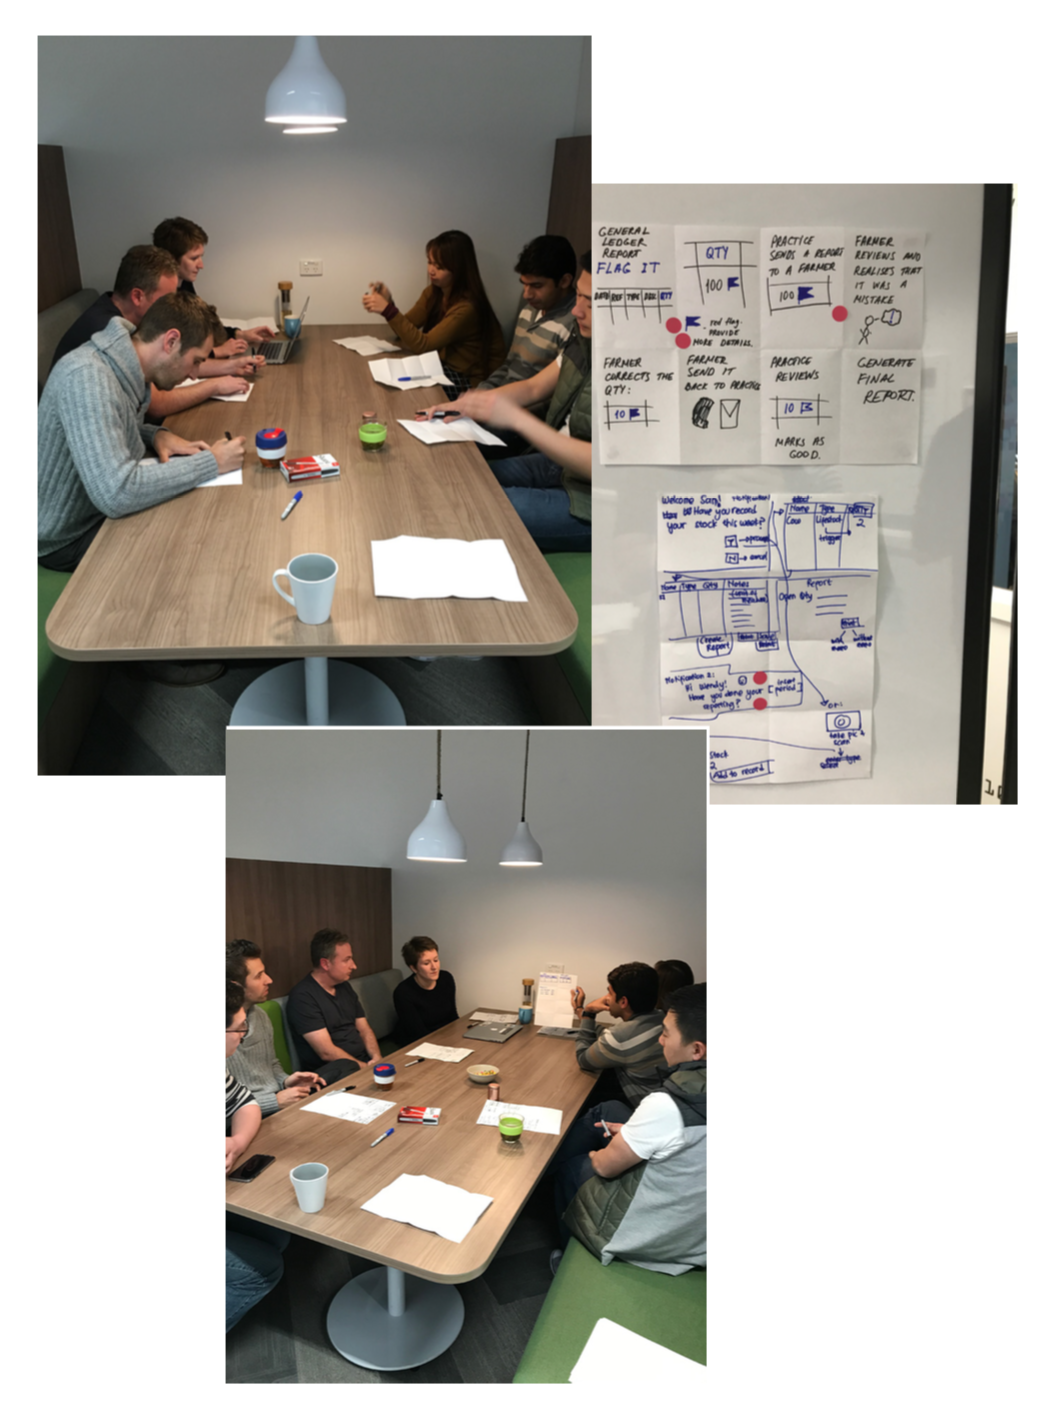
Running design workshops with the team
INITIAL Feedback
Generally the changes were well received with some exceptions such as:
Quantities had to be reflected in more places than we initially designed for e.g. certain reports and averages and totals for quantities introduced.
Only Australian clients would be able to migrate because New Zealand clients required additional features.
Pilot
After finessing the UI to include feedback from our initial user test, a pilot of about 1000 selected users was launched and all feedback gathered over 8 weeks. As feedback was received, the team made pivots and instant incremental changes to the UI until a final product could be released.


Client feedback

Capturing pilot metrics
Launch and impact
After launch, the sales of online ESS* software reflected significant impact from the updates - between 136% (Australia) and 316% (New Zealand) of targets for that quarter. This included BL* clients migrating specifically because of the updates in functionality.